Microsoft Corporation Intune
Overview
A connector is used to establish communication between the SNYPR application and a datasource. Following a successful deployment, the connector makes data from a datasource available to query and view in the SNYPR application.
The instructions in this deployment guide describe how to deploy Microsoft Corporation Intune security log data in the SNYPR application.
Note: This beta connector guide is created by experienced users of the SNYPR platform and is currently going through verification processes within Securonix. This connector is made available to early adopters for the purposes of providing guidance and integration support prior to the release of official documentation.
The following properties are specific to the Microsoft Corporation Intune connector:
-
Collection method: eventhub (API)
-
Format: JSON
-
Functionality: Cloud Content Management System
-
Parser: SCNX_MICROS_MICROSOFTINTUNE_CCMS_EVE_JSO_COMM
-
Vendor version: -
Prerequisites
Before you connect Microsoft Corporation Intune, ensure the user is a Global Administrator or Intune Service Administrator for the Intune tenant.
References
https://learn.microsoft.com/en-us/mem/intune/fundamentals/review-logs-using-azure-monitor.
Configure the connection on device
Complete the following steps to configure the Microsoft Corporation Intune connection:
Configure Microsoft Intune to stream events to your Azure Event Hubs
-
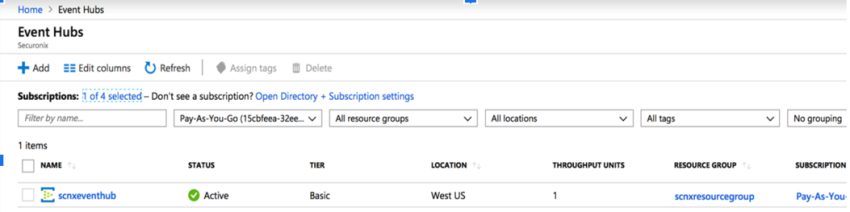
Navigate to the Event Hub Name space where the data will be forwarded.
-
Capture the Event Hub Namespace.
-
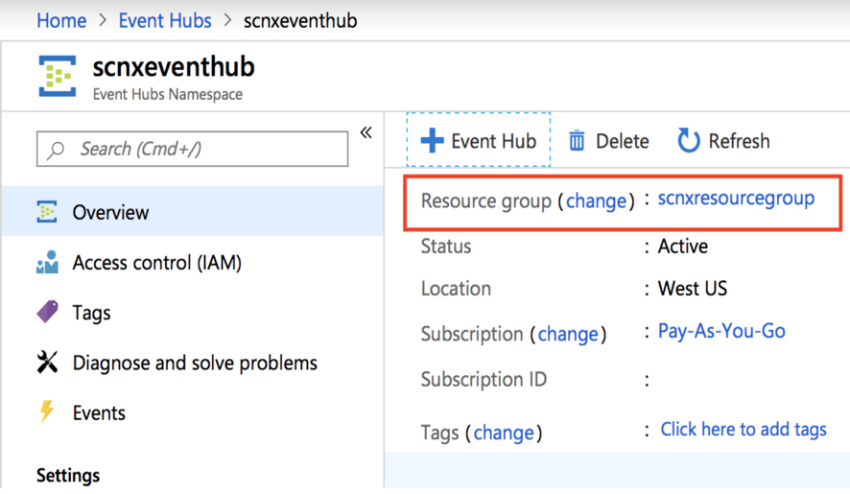
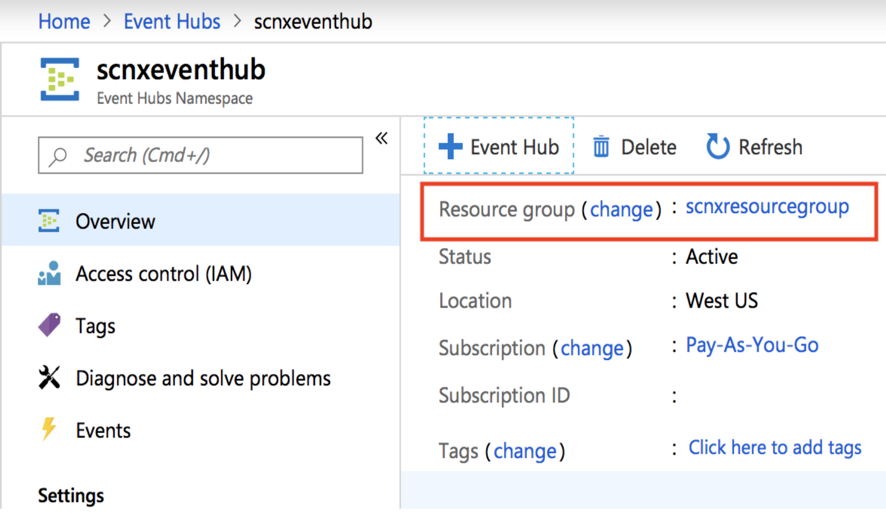
Click on the Event Hub namespace.
-
Capture the resource group name associated. You will use the resource group name while creating a Storage Account in later steps.
-
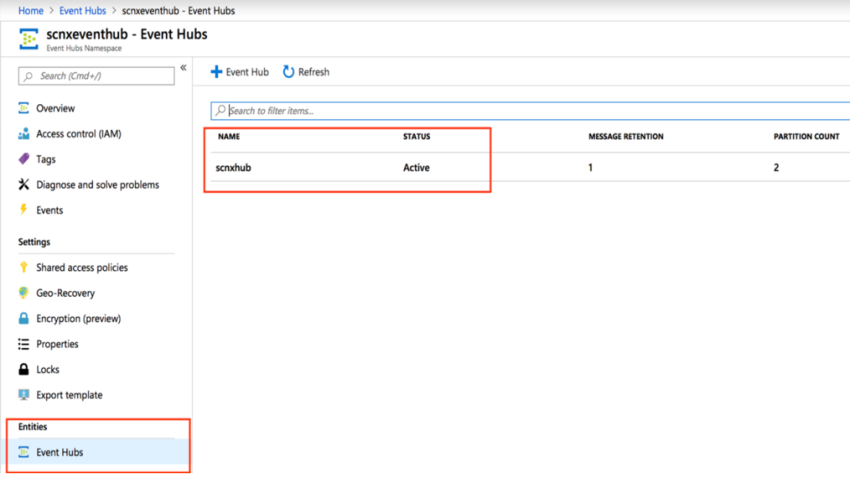
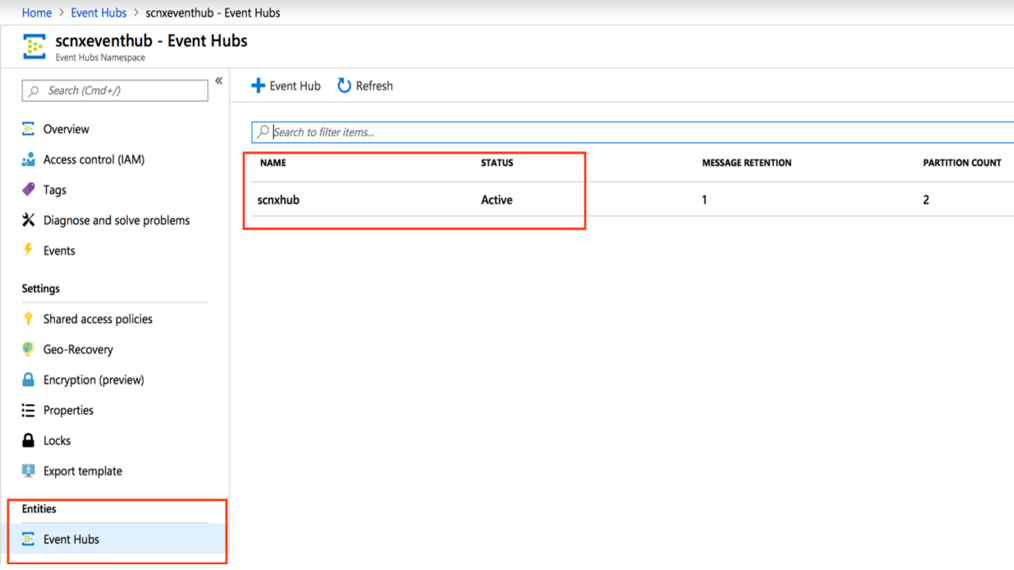
Select Event Hub under Entities in the left panel.
-
Click on the Event Hub where your data resides.
-
Capture the Event Hub Name.
-
Click on the Event hub name.
-
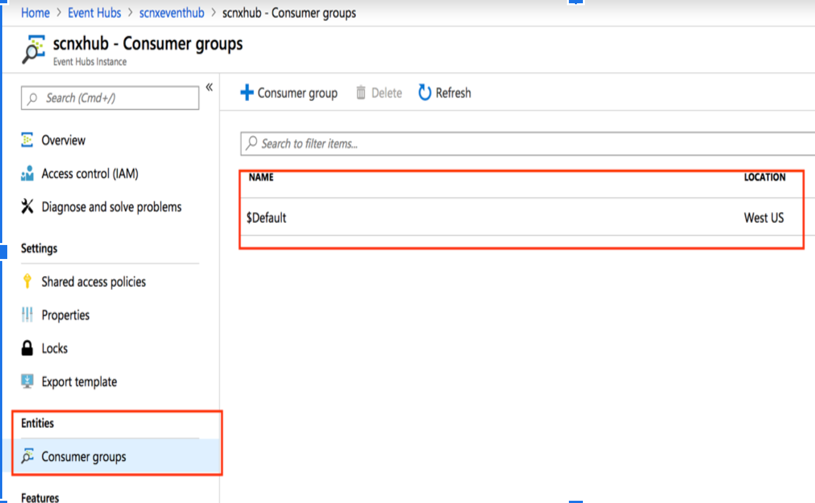
Click on the consumer group on the left panel. If Securonix is the only consumer, use $Default.

-
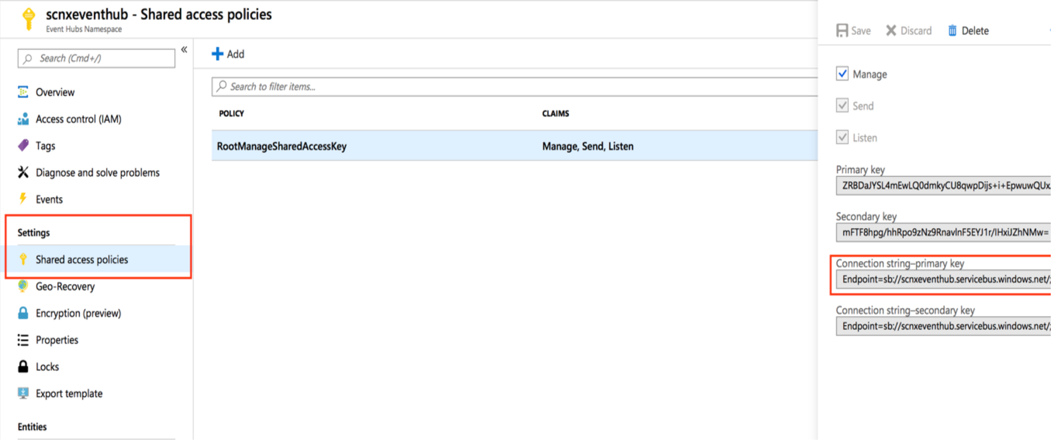
Click Shared access policies.
-
Select RootManageSharedAccessPolicy.
-
Capture the Connection string-primary key.


Configure Logs
-
Sign in to the Microsoft Endpoint Manager admin center.
-
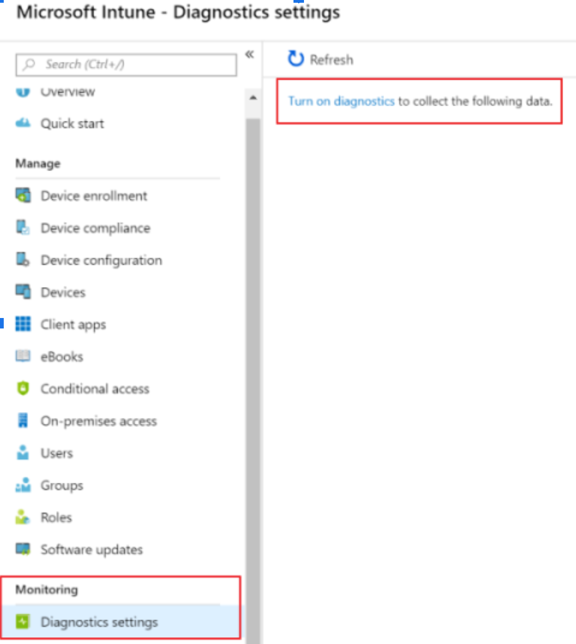
Select Reports > Diagnostics settings. The first time you open it, turn it on. Otherwise, add a setting.
-
Complete the following if your Azure subscription isn't shown:
-
Navigate to the top right corner.
-
Select the signed in account > Switch directory.
Note: You might have to enter the Azure subscription account.
-
-
Enter the following properties:
- Name: Enter a name for the diagnostic settings. This setting includes all the properties you enter.
-
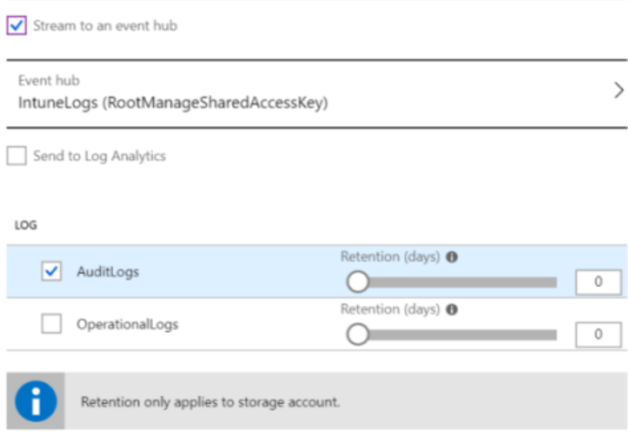
Stream to an event hub: Streams the logs to an Azure event hub. If you want analytics on your log data using SIEM tools, choose this option.:
-
Select this option > Configure.
-
Choose an existing event hub namespace and policy from the list > OK.
-
-
Choose LOG > AuditLogs to send the Intune audit logs to your event hub. The audit logs show the history of every task that generates a change in Intune, including who did it and when.
-
Choose LOG > OperationalLogs to send the enrollment logs to your event hub. Operational logs show the success or failure of users and devices that enroll in Intune, as well as details on non-compliant devices.
-
Choose LOG > DeviceComplianceOrg to send the compliance logs to your event hub. Device compliance organizational logs show the organizational report for Device Compliance in Intune and details of non-compliant devices.
-
Choose LOG > IntuneDevices to send the IntuneDevices logs to your event hub. The Intune Device log shows device inventory and status information for Intune enrolled and managed devices.
When complete, your settings look similar to the following:

-
Save your changes. Your setting is shown in the list. Once it's created, you can change the settings by selecting Edit setting > Save.

Configure the connection in SNYPR
Complete the following steps to configure Microsoft Corporation Intune in the SNYPR application:
Step 1. Resource group information
-
Navigate to Menu > Add Data > Activity in the SNYPR application.
- Click Add Data > Add Data for Supported Device Type to setup the ingestion process.
-
Click Vendor in the Resource Type Information section and select the following information:
- Vendors: Microsoft Corporation
- Device Types: Microsoft Intune
- Collection Method: Event Hub[JSON]
-
Select an ingester from the list.
- Complete the following information in the Device Information section:
- Datasource Name: Microsoft Intune
- Specify timezone for activity logs: Select a time zone from the list.
-
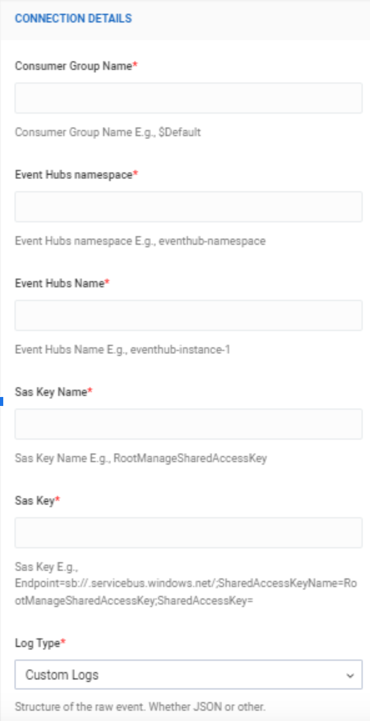
Complete the following information in the Collection Details section:

- Consumer Group Name
- Event Hubs namespace
- Event Hubs Name
- Sas Key Name
- Sas Key
- Log Type: Custom Logs
-
Parsing technique: JSON parser
-
Click Get Preview in the upper right corner of the page to preview the ingested data from the datasource.
- Click Save & Next.
Step 2. Parser management
Click Save & Next.
Note: For more information on Parser Management, refer to the SNYPR 6.4 Data Integration Guide.
Step 3. Identity attribution
-
Click Add Condition > Add New Correlation Rule to add a correlation rule.
-
Provide a descriptive name for the correlation rule in the Correlation Rule section.
Note: For more information on Identity Attribution, refer to the SNYPR 6.4 Data Integration Guide.
-
Specify the User Attribute, Operation, Parameter, Condition, and Separator parameters in the Correlate events to user using rule section.
-
Click Save in the lower-right corner of the page to save the Correlate events to user using rule table.
-
Click Save & Next in the upper-right corner of the page.
Step 4. Detect policy violations
Click Save & Next.
Step 5. Summary
-
Select Do you want to schedule this job for future? in the Job Scheduling Information section and select any of the following based on the collection method:
-
Run every 1 minutes for datasources with the collection method as syslog.
-
Run every 10 minutes for non-syslog based datasources.
-
-
Click Save & Run.
Verifying the job
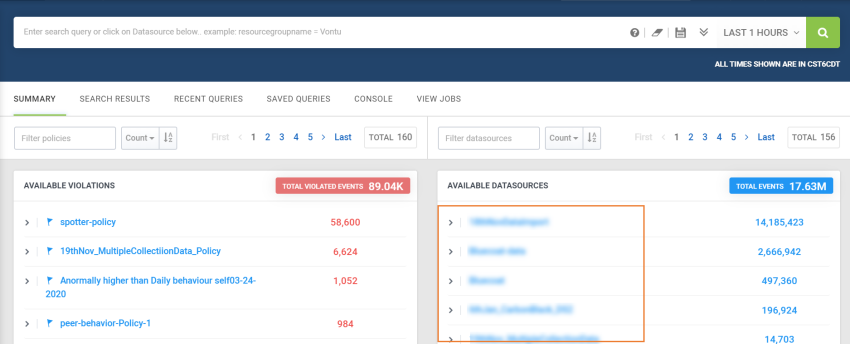
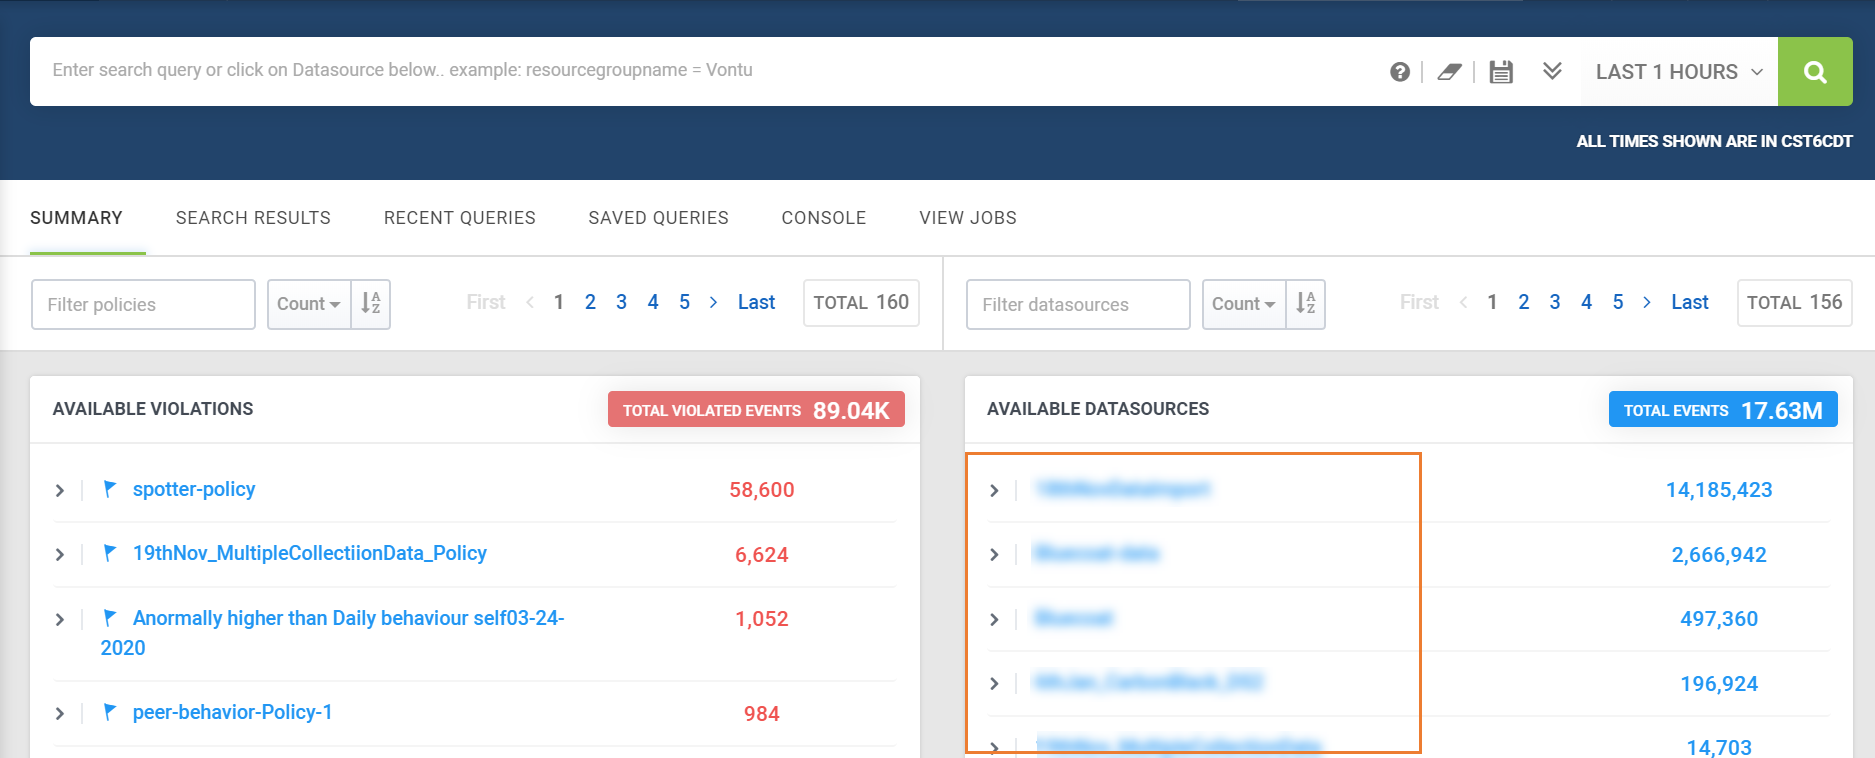
Following a successful import, the security log data for the datasource is accessible in the Available Datasources section of Spotter. To access the imported security log data, complete the following steps:
-
Navigate to Menu > Security Center > Spotter.
-
Enter the datasource name provided while creating the connection, and then click the magnifying glass icon in the search bar.
Note: Refer to the Spotter Query Reference Guide for information on how to write queries in Spotter.